les Nouvelles November 2015 Article of the Month
Risk And Return: Understanding The Cost Of Capital For Intellectual Property Part 2 of 2
 Glenn Perdue
Kraft Analytics LLC,
Managing Member,
Nashville, TN
VIII. Introduction To Part 2
This is the second part of a two-part paper. In Part 1, key concepts related to risk, return, income-based valuation, and the cost of capital and returns on assets were explored. Part 1 concluded with Section VI which considered how differing types of IP monetization approaches can affect the selection of an appropriate discount or capitalization rate. Part 2 continues below.
IX. Discount Rate Sources, Signposts And Calculation Methods
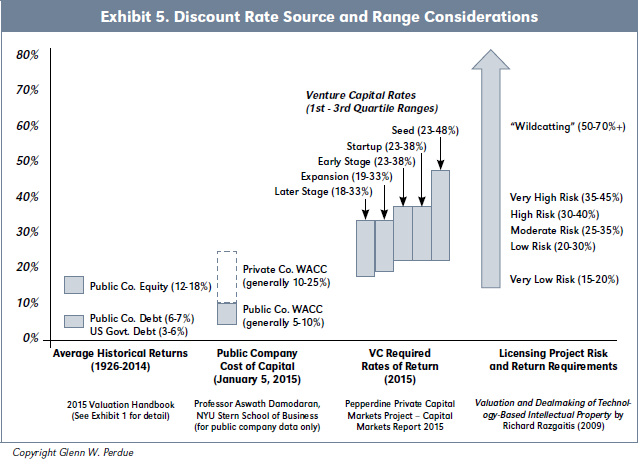
Exhibit 5 summarizes ranges of investment returns from various sources. Beyond providing context, this exhibit further illustrates how increased risk results in a logical expectation for increased returns.
The first column in Exhibit 5 summarizes average historical returns as presented in Exhibit 1 for government and public company debt (3-7 percent) and public company equity (12-18 percent). The second column in Exhibit 5 presents general value ranges for public company WACCs (5-10 percent)1 and private company WACCs (10-25 percent).2 The third column provides expected gross returns for venture capital investments for 5 stages from seed capital to later stage ventures that range from 18 percent to 48 percent. The final column summarizes licensing project return requirements developed Dr. Richard Razgaitis of 15-70 percent or more.3
Not surprisingly, the bulk of the rates cited by Dr. Razgaitis from “Low Risk” to “Very High Risk” correspond to venture capital rates, thus suggesting comparable levels of risk and expected returns. This makes sense because many venture capital investments, such as those made in Silicon Valley, are rooted in proprietary technology and intellectual property.

Based upon what’s been presented thus far, we see that certain signposts become apparent in determining an appropriate discount rate for use in financial analysis involving technology and intellectual property. These signposts are:
- The WACC which generally provides a floor value since IP and other intangible assets are generally more risky than financial and tangible assets, thus necessitating returns at or above the WACC (see Exhibit 2).
- Returns on Assets determined as part of a valuation exercise based on weighted average return analysis in which returns for IP asset groups and other intangibles are calculated (see Exhibit 3).
- The Cost of Equity which reflects the cost of “risk capital” thus corresponding more closely with the riskier assets of the business for which stand-alone debt financing may be difficult to obtain. Unlike the cost of debt which is generally based on a stated interest rate, the cost of equity is a function of market-based returns needed to compensate for the risk of holding the asset. With public companies, these returns are mediated by a fluctuating stock price.
- Venture Capital Rates which reflect rates used in funding higher-risk business ventures based on proprietary technology and intellectual property. Venture capital rates may also be appropriate for use in analyzing capital investment projects or ventures within a company that present risks greater than that of the company as a whole (e.g., the Fortune 500 company’s investment in ABC Systems as introduced in Section IV).
The above are referred to as signposts because an appropriate rate may lie between or above these published or calculable rates. And in some cases, multiple sources of information as discussed herein may be used to triangulate on an appropriate discount rate.
While the WACC was introduced in Section V, we see that the cost of equity is not only a critical component of the WACC calculation, but also an important discount rate signpost in its own right. The remainder of this section considers methods of determining a cost of equity as a consideration in the assessment of an appropriate discount rate for technology and IP-related financial analysis.
Capital Asset Pricing Model (CAPM)
As introduced in Section IV, at its most basic level, a cost of capital can be decomposed into a risk-free rate and a risk premium. The CAPM provides a way of calculating the risk premium for an individual stock or group of stocks as a function of its price volatility relative to the overall market as reflected by a variable known as “Beta.” Economist William Sharpe received a Nobel Prize for his work in this area which was presented initially in 1970. The CAPM can be stated algebraically as:
Re = Rf + (Rm - Rf)β
Where:
Re = required rate of return for the stock or group of stocks
Rf = risk-free rate of return
Rm = equity market rate of return.
(Rm – Rf) = equity market risk premium
β = beta for a specific stock or group of stocks
While the CAPM is a commonly used tool in the context of developing diversified investment portfolios, it may not produce meaningful results relevant to a cost of equity calculation for use in an IP valuation. This challenge results primarily from the manner in which Beta is used as a proxy for risk. More specifically, Beta suffers from challenges with its reliance on price volatility and correlation measures along with problems related to the historical period from which data is obtained to calculate Beta.4
Problems with the CAPM can be particularly pronounced with technology and IP-based companies that may exhibit unconventional characteristics, such as a lack of profits or even revenues as occurs with life science companies. In these cases, use of the CAPM can lead to perverse, unreliable estimates for the cost of equity.
Build-Up Method
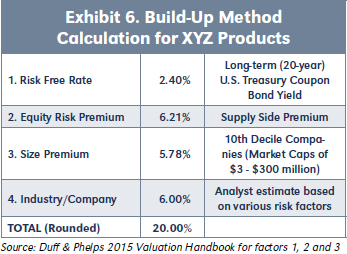
The build-up method also begins with the risk-free rate and equity risk premium but then considers additional layers of risk that, if present, form the basis for additional premiums associated with company size, the industry and the company in the general. Exhibit 6 presents a build-up method calculation example for XYZ Products:
The 20 percent cost of equity derived above is the cost of equity used in Exhibit 2 to derive XYZ’s WACC.5
The risk free rate is provided in the cited publication and can also be obtained from the St. Louis Federal Reserve for more specific periods. However, the added precision of obtaining daily or monthly rates is generally unnecessary in a technology or IP-related valuation.

As introduced in the CAPM discussion, the equity risk premium is the additional return that can be obtained above the risk-free rate by investing in public equities. Based on use of the published risk-free rate, it is generally-accepted practice to also use the supply-side equity risk premium.6
The size premium in this example was based upon the market value of equity. However, in the publication cited, book value, sales, employee count and other factors can also be used as the basis for company size and the size premium.
While certain industry premiums are also provided in the publication cited, it is common practice for industry and company premiums to be considered together in developing the final factor. This final combined premium typically ranges from 1-10 percent.
Private Capital Market Rates
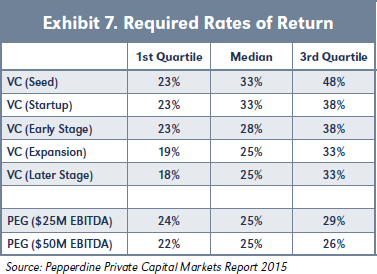
Exhibit 5 presents venture capital (VC) rates ranging from 18-48 percent for five different stages of investment as detailed more fully in Exhibit 7. While the Pepperdine Survey from which these rates were obtained also provides required rates of return for other sources of private capital, Exhibit 5 focuses on VC rates due to their particular relevance in technology and IP-related financial analysis. In considering the cost of equity for an established business, rates of return sought by private equity groups (PEGs) may also be helpful.7
While venture capital firms tend to focus on younger, riskier businesses which may not have profits or even revenues, private equity groups tend to focus on established businesses with a history of both. As illustrated in Exhibit 7, PEG rates make sense when viewed in the context of later stage VC rates, but also reflect less variability.
Private equity groups may use inexpensive debt to facilitate leveraged buy-outs but seek equity-level returns as evidenced in Exhibit 7. PEGs may engage in financial engineering and strategic initiatives to aid in generating desired returns. For instance, PEGs are often involved in industry roll-ups to consolidate multiple companies within an industry to exploit economies of scale and generate cost-efficiencies. PEGs can be activist owners of traditional businesses such as manufacturing and distribution companies. In this regard, PEG rates of return may be helpful in assessing the cost of equity for a traditional business with revenues and profits, but not necessarily for a technology or IP-based business.

The appropriate venture capital rate may sufficiently capture IP-specific risks because business success in many venture-backed companies is largely based on IP and other intangibles such as proprietary software protected as a trade secret or life science technology protected through patents. In addition, the proportion of intangible assets is often very high with early-stage businesses. Since relatively few tangible assets may be present in an early-stage business, debt financing is often difficult to obtain, thus making the cost of equity a more relevant, and potentially exclusive, consideration in determining the cost of capital for technology and IP.
But even the venture capital rates identified in Exhibit 7 may not sufficiently capture the risk associated with an IP-based investment. For instance, borrowing an expression from the oil exploration industry, Dr. Razgaitis uses the term “wildcatting” to reference projects of extremely high risk for which discount rates of 50-70 percent or more may be appropriate (see Exhibit 5).
The 50 percent rate cited by Dr. Razgaitis coincides with the 48 percent third-quartile seed rate for venture capital. Dr. Razgaitis references a start-up company going 3into business to make a product not presently sold or even known to exist using unproven technologies to characterize this type of risk, a characterization consistent with that of a seed capital investment. Keep in mind, the 48 percent seed capital rate is a third quartile rate meaning that another 25 percent of the observations in the sample were above this level and thus reached deeper into the 50-70 percent range cited by Dr. Razgaitis.
X. Differences In Rates and Approaches
Great variety can be observed in the range of rates used and the manner in which risk is considered for different types of IP. The two examples that follow illustrate this variety. These examples also contrast IP with a history of direct cash generation to IP that lacks such history and may never generate returns.
Royalty-Generating Music Copyrights
As mentioned in Section II, the capitalization of annual rent payments is used extensively in the valuation of real estate. Under this approach a capitalization rate of 20 percent is equivalent to a capitalization multiple of 5.0 because these values are inversely related. Put another way, multiplying an annual rent amount by 5.0 provides the same result as dividing by 0.2.
The valuation of royalty-generating music copyrights also relies extensively on the use of capitalization multiples and capitalization rates as applied to annual royalty payments received after splits with other parties sharing in the royalty stream. Parties that might share in musicrelated royalty streams include publishing companies, co-writers and producers.
Prior to a period of consolidation within the industry in the late 1980s, a capitalization multiple of 4–8 times net publishers share8 was cited as a typical range in valuing music publishing companies for acquisition purposes.9 In 1997 new interest was sparked in royalty-generating copyrights by the issuance of $55 million in “Bowie Bonds,” bonds securitized by song royalties from 25 David Bowie albums recorded before 1990.10 In 2001, UK-based Chrysalis Music followed suit by securitizing its catalog. During this period, private equity groups and pension funds also invested in music catalogs and contributed to capitalization multiples that, in certain cases, approached 20 times earnings.11
More recently, large catalogs filled with iconic songs do not appear to have commanded the lofty 20x multiples seen in the past. A 2009 article discussing Michael Jackson’s estate and his ownership interest in the Sony/ ATV catalog (which includes some 250 Beatles songs) considers this issue and states the following:12
“When Universal Music bought BMG Music Publishing in September 2006, Universal paid $2.1 billion, or nearly 12 times BMG’s estimated net publisher’s share. Sony/ATV wouldn’t get that same multiple in today’s market. But even at 10 times its current publisher earnings, the company would be worth $2 billion.”
In 2002, Harlan Howard, one of Nashville’s most prolific songwriters, died at the age of 74. Rights associated with his songwriter royalties became the focus of an estate dispute that considered the value of these assets. In 2009, the appellate court affirmed the trial court’s decision.13
In Howard the court considered testimony from various experts regarding the value of songwriter royalties, a focal point of the dispute. The court considered testimony from various experts that suggested the widest possible range of values for Howard’s royalties was 5-10 times its average annual income, thus equating to capitalization rates of 10-20 percent.
Ultimately, the multiple paid by a rational buyer for a music catalog is driven by the relative certainty, duration, and expected growth (or decline) in cash flows. Some specific factors a buyer might consider include:
- Overall size of the catalog
- Number of hits in the catalog
- Presence of “evergreen” songs considered to be classics or standards
- Number of times the songs have been recorded
- Stature of the writer
- Stature of artists that recorded the songs
In addition to the above, a prospective buyer might also consider additional sources of licensing revenue it could obtain that the previous owners had not fully capitalized upon. These sources of new revenue could include: new artists recording and releasing catalog songs; compilation releases; and untapped uses associated with video games, movies, television, and ringtones.
Based on the above characteristics and differences that may exist within a portfolio, different multiples may be applied to royalties for certain songs or groups of songs. This is particularly true for evergreen songs in the catalog that may command higher multiples.
The fact that music royalties can be securitized underscores the fact that the underlying IP rights are cashgenerating assets against which money can be borrowed. Beyond bonds specifically developed around this type of IP, some traditional banks also make loans against royaltygenerating music catalogs. These banks may advance 50- 75 percent of the appraised value of a catalog using the IP as collateral.14 The availability of debt capital for this type of IP financing helps to explain historic capitalization rates of 5-25 percent based on a 20x and 4x capitalization multiple, respectively.
Pre-Approval Pharmaceutical Patents
The music copyright discussion above considers the valuation of IP for which there is a history of royaltygeneration. Now let’s consider the valuation of a drug patent for which royalty generation may not occur for years, if at all.
Executives in the biopharmaceutical industry benefit from the fact that FDA data is available to inform historic clinical trial approval rates. Additionally, detailed data from IMS Health and others is available to provide a relatively clear picture of the market and competition. The industry is also filled with smart executives and analysts that know where to find, and how to use, this information.
Yet despite superior data availability and market transparency, it has been estimated that two-thirds of drug launches fail to meet pre-launch sales expectations during their first year on the market. Furthermore, of those launches that lagged first-year forecasts, 78 percent continued to do so in the second year. And in year 3, 70 percent of those that lagged in year 2 continued to lag.15
The fact that new biopharmaceutical products consistently fail to meet forecasted revenues underscores how estimating sales for any new product can be a challenge. The uncertainty associated with forecasts for products—including biopharmaceutical products—that have never generated revenues supports the need for a discount rate that properly reflects this risk. But in this assessment, it is important to avoid double counting for risks such as those for clinical trial approval that may have been accounted for through other means.
Prelaunch biopharmaceutical products face risks associated with demand and adoption uncertainty like those of other new products. But this uncertainty is complicated further in the biopharmaceutical industry by the way we pay for healthcare in the United States. Simply put, government and commercial payers may not be willing to provide reimbursement for a new drug sufficient for it to generate expected profits and returns.

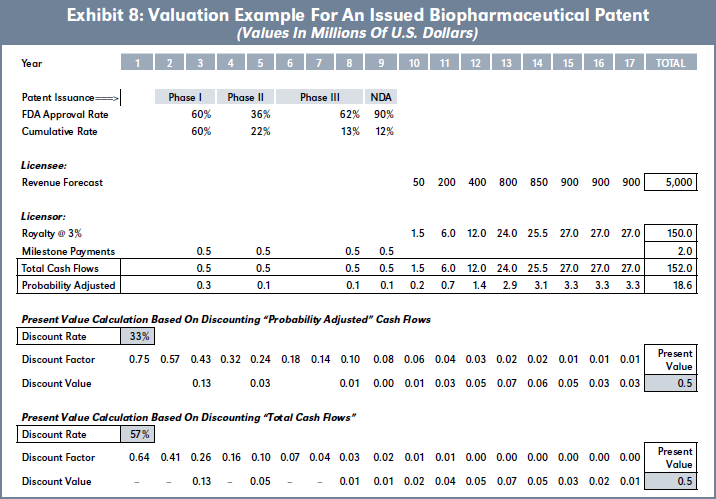
Exhibit 8 provides an example of how risk may be considered through probability adjustments and discounting in a licensing scenario involving an issued biopharmaceutical patent from the licensor’s perspective. This example is based upon:
- The licensor being a university;
- The licensee planning to develop a therapeutic product based on the newly-issued patent;16
- Patent issuance occurring 3 years after filing such that 17 years of patent life remain at the time of valuation;
- Plans to enter Phase 1 clinical trials in a year;
- Assumed approval success rates that mirror overall FDA approval rates;17
- Forecasted product revenues totaling $5 billion during an 8-year period of sales that conclude with patent expiration;
- A 3 percent royalty rate;
- $500,000 milestone payments to the licensor for each FDA approval;
- A 33 percent discount rate based on the median rate for seed and start-up investments noted in Exhibit 7.
For reasons cited previously, including the fact that the product considered in Exhibit 8 is years away from being available, it makes economic sense to use a venture capital rate in conjunction with FDA probability adjustments that consider specific FDA approval risks.
Using the 33 percent discount rate as applied to probability-adjusted milestone and royalty payments, a present value of $500,000 is derived in Exhibit 8.
To isolate the impact of probability adjustments, Exhibit 8 also calculates the discount rate that would be required to obtain the same $500,000 present value if probability adjustments were not included. In essence, this second calculation considers what the discount rate would be if FDA approval risk was “baked-in” to the discount rate and not considered separately.
The 57 percent rate derived in the second present value calculation is 24 percentage points higher than the 33 percent rate used in the first present value calculation. This means that FDA approval risk represents approximately 42 percent of the overall risk considered in this model as reflected in the 57 percent discount rate.18
XI. Conclusion
In determining a discount or capitalization rate for technology and IP-related projects, one must consider the risks and returns associated with the realization of expected cash flows. Guided by the overarching consideration of market-based returns generally expected by capital providers, some specific considerations in determining an appropriate discount or capitalization rate for technology and IP-related projects include:
- The method of IP monetization;
- Sources of risk that can be considered through probability adjustments or other means and how use of these approaches to risk quantification should impact the selected rate;
- Whether historic cash flows have occurred and provide support for cash flows being forecasted;
- Whether the product or service is completely new or related to existing offerings with market history;
- Whether the product or service is integrated as part of an existing enterprise or is the basis of a new venture;
- The degree to which demand for the product or service that will embody the IP is understood or uncertain;
- Competition for prospective buyers of the product or service that embody the IP;
- Market availability of funding for the project through debt and/or equity sources.
A company’s WACC and cost of equity are relevant metrics to consider in developing an IP-related discount rate. A company can also develop asset-specific discount rates based on its WACC and corresponding weighted average returns for assets. But with new businesses, or new ventures being incubated within existing businesses, venture capital rates may be more applicable in performing financial analysis when the business is driven by technology or IP.
- This general range is based on WACC ranges for public companies as presented through 95 industry groups.
- The private company WACC range is based on the experience of the author in performing hundreds of private company valuations and in obtaining ongoing professional education in the valuation field.
- Valuation and Dealmaking of Technology- Based Intellectual Property by Dr. Richard Razgaitis (2009).
- Harvard Business Review (October 2002), “What’s You Real Cost of Capital?,” by James J. McNulty, Tony D. Yeh, William S. Schulze, and Michael H Lubatkin.
- Since public company data is used to derive a cost of equity using the CAPM and the Build-Up Method, the resulting value is for a marketable minority interest on an after-tax basis.
- Discussion of risk-free rate equity risk premium options and differences is beyond the scope of this article.
- Rates of return expected by venture capital firms and private equity groups are generated by investments that meet the selection criteria of the fund.
- In the music publishing industry, “net publishers share” is a common measure of cash flow used for valuation purposes and represents the portion of royalties retained by the publishing company after paying songwriters.
- William K. Knoedelseder Jr., “Song Publishers Call the Tune in a Seller’s Market,” L.A. Times, January 9, 1989.
- “Bowie Bonds” are often discussed in the broader context of Celebrity Bonds. See http://en.wikipedia.org/wiki/Celebrity_ bond (last accessed 2/28/2015). It appears that Bowie Bonds may have been the first instance of intellectual property rights being securitized.
- Dan Sabbagh, “EMI Rebel Needles Music Group with Valuation Demand,” London Times (Feb 20, 2007); Yinka Adegoke, “Music Publishing’s Steady Cash Lures Investors”, Reuters (Apr 24, 2009). Based on interviews with industry professionals, the author is aware of at least one instance during this period in which a multiple in excess of 20 times was offered for a catalog.
- Stephen Gandel, “Michael Jackson’s Estate: Saved by the Beatles,” TIME.com (Jul 1, 2009).
- In re Estate of Harlan Perry Howard; Melanie Smith Howard, Executrix v. Harlan Perry Howard, Jr., and Jennifer Howard Carmella, No. M2008-00540-COA-R3-CV (Tenn. App. July 22, 2009).
- Based on discussion with music industry bankers.
- The Secret of Successful Drug Launches by Hemant Ahlawat, Giula Chierchia, and Paul van Arkel as published online, March 2014 by McKinsey and Company.
- If the patent had been applied for but not issued, the likelihood of patent approval would present another source of risk to consider.
- Cost of Developing a New Drug as presented by the Tufts Center for the Study of Drug Development on November 18, 2014. This presentation presented overall phase transition approval statistics for the sample group studied.
- 0.33 + 0.24 = 0.57 and 0.24/0.57 = 42%. These calculations and rates are specific to this example. FDA approval risks and other business risks are project-specific and should be estimated and calculated accordingly.