les Nouvelles July 2015 Article of the Month
Technology Intangible Asset Valuation Procedures
Managing Director
Willamette Management Associates
Chicago, IL USA
Analysts perform technology intangible asset valuation, damages, and transfer price analyses for many purposes. This discussion defines technology intangible assets and summarizes the generally accepted approaches and methods related to such an intangible asset valuation, damages, or transfer price analysis. In addition, this discussion illustrates a technology intangible asset valuation.
Introduction
Valuation analysts (“analysts”) are often called on to value technology intangible assets. Analysts can apply the three generally accepted intangible property valuation approaches—i.e., the cost approach, market approach, and income approach—to value such intangible assets. Analysts are also called on to perform damages and transfer price analyses related to technology intangible assets. As with valuation, there are generally accepted intangible asset damages and transfer price measurement methods.
Analysts are often retained by either the owner/ operator or legal counsel to perform the technology intangible asset valuation, damages, or transfer price analysis. Such analyses may be performed for various transaction, taxation, financing, litigation, corporate planning, or financial accounting purposes. This discussion presents (1) the definition of technology intangible assets; (2) the distinguishing attributes of technology intangible assets; (3) the typical factors that affect technology intangible asset value, damages, and transfer price; and (4) the factors that analysts commonly consider in assessing technology intangible asset value and remaining useful life (RUL). In addition, this discussion presents an illustrative example of a technology intangible asset valuation.
For purposes of this discussion, technology intangible assets are broadly defined as intangible assets that create proprietary knowledge and processes. This proprietary knowledge or process may be either developed or purchased by the owner/operator. In order for a technology intangible asset to have value, it should provide, or have the potential to provide, a competitive advantage or a product differentiation. Any proprietary technology that confers a competitive advantage or product differentiation to the owner/operator may be a technology intangible asset.
For purposes of this discussion, let’s include the following intangible assets in this category:
- Patents
- Patent applications
- Patentable inventions
- Trade secrets
- Know-how
- Proprietary processes
- Proprietary product recipes or formulae
- Confidential information
- Copyrights on technical materials such as computer software, technical manuals, and automated databases
Copyright-related intangible assets, software-related intangible assets, and patents and related intellectual property are included in the technology intangible asset category. However, this discussion focuses on knowhow, trade secrets, proprietary processes, product recipes and formulas, and confidential information.
Due Diligence Procedures
Whether the analysis objective is a value, damages, or transfer price estimate, the analyst should understand the attributes of the technology intangible asset. Analysts often consider these attributes through the following due diligence questions:
- What are the property rights related to the technology intangible asset? What are the functional attributes of the intangible asset?
- What are the operational or economic benefits of the technology intangible asset to its current owner/operator? Will those operational or economic benefits be any different if the intangible asset is in the hands of a third-party owner/operator?
- What is the current utility of the technology intangible asset? How will this utility change in response to changes in the relevant market conditions? How will this utility change over time? What industry, competitive, economic, or technological factors will cause the intangible asset utility to change over time?
- Is the technology intangible asset typically owned or operated as a stand-alone asset? Or is the intangible asset typically owned or operated as (a) part of a bundle with other tangible assets or intangible assets or (b) part of a going concern business entity?
- Does the technology intangible asset utility (however measured) depend on the operation of tangible assets or other intangible assets or the operation of a business entity?
- What is the technology intangible asset highest and best use (HABU)?
- How does the technology intangible asset affect the income of the owner/operator? This inquiry may include consideration of all aspects of the owner/operator’s revenue, expense, and investments.
- How does the technology intangible asset affect the risk (both operational risk and financial risk) of the owner/operator?
- How does the technology intangible asset affect the competitive strengths, weaknesses, opportunities, and threats of the owner/ operator?
- Where does the technology intangible asset fall within its own technology life cycle, the overall technology life cycle of the owner/ operator, the life cycle of the owner/operator industry, and the technology life cycle of both competing technologies and substitute technologies?
These inquiries do not present an exhaustive list of due diligence considerations. However, this due diligence gives the analyst a starting point for understanding the use and function of the technology intangible asset and the attributes that create value in the technology intangible asset.
Value, Damages, or Transfer Price Attributes
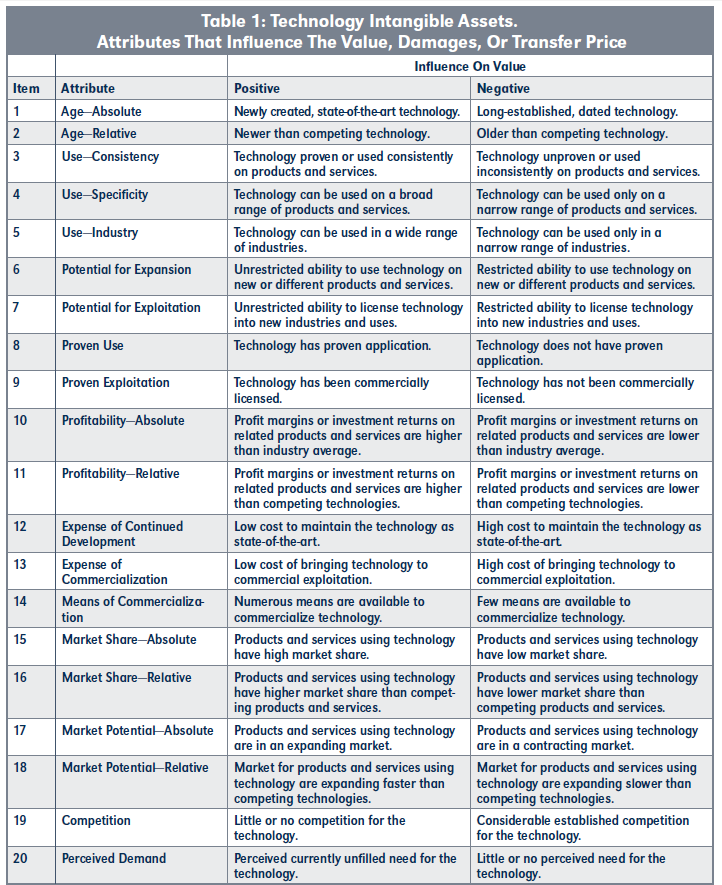
Numerous factors affect the technology intangible asset value. Industry, product, and service considerations provide a wide range of positive and negative influences on the intangible asset value. To the extent possible, analysts qualitatively and quantitatively consider each of these factors. Table 1 presents some of the attributes that analysts consider in the valuation, damages, or transfer price analysis. Table 1 also provides an indication of how these attributes may influence the value, damages, or transfer price estimate.
Not all of the Table 1 factors apply to every intangible asset, and each attribute does not have an equal influence on the intangible asset. However, analysts typically consider each of these factors, either quantitatively or qualitatively.
Some of the other factors to consider include (1) the legal rights associated with the intangible asset, (2) the industry in which the intangible asset is used, (3) the economic characteristics of the intangible asset, (4) the reliance of the owner/operator on tangible assets or other intangible assets, and (5) the expected impact of regulatory policies or other external factors on the commercial viability or marketability of the intangible asset.
Specific Factors In The Intangible Asset Analysis
The purpose for the analysis may influence the consideration of other individual factors. Factors that may be particularly relevant for one purpose may be more or less relevant for another purpose.
Assessing Intangible Asset Damages
A damages analysis may involve the application of valuation principles and procedures. In the typical intangible asset damages analysis, analysts may measure lost profits or estimate a reasonable royalty rate. In addition, analysts could measure lost asset value or the cost to cure the technology intangible asset. There are a number of differences between measuring technology damages for controversy purposes and estimating technology value for transactional purposes. Some of the factors that analysts consider in assessing damages include the following:
- The calculation of the amount of income (however defined) that the intangible asset would have earned or contributed but for the damages event (as compared to the amount of income that the asset actually did earn or contribute after the influence of the damages event).
- An analysis of the amount of income (how ever defined) that the intangible asset owner/ operator will earn with the influence of the damages event (as compared to a benchmark or yardstick level of income that the owner/ operator would expect to earn without the influence of the damages event).
- A quantification of the amount of income (however defined) decrease that the owner/ operator experienced since the damages event, where that decremental income is related to lost market share, lost market penetration, lost unit volume revenue, lost unit selling price revenue, increased production costs, increased selling costs, increased research and development costs, increased capital investment, increased working capital investment, increasing cost of capital, or some other measure of lost profits.
- An analysis of the loss of the owner/operator’s ability to be first-to-market, inflence market prices, obtain patent or other legal protection, obtain regulatory approval, fulfill a contract or other commercial commitment, develop a replacement intangible asset, create or develop a replacement or
improvement, or commercialize a replacement or improvement intangible asset. These analyses may be used to quantify the owner/operator’s loss with respect to the damages event.
- A projection of the amount of actual or hypothetical royalty income that the owner/ operator will forgo as a result of the damages event. That royalty income relates to the actual or hypothetical intangible asset license (but before the intangible asset experiences any of the effects of the damages event).
- The calculation of the amount of damages suffered by the owner/operator to date (for example, from the time the damages event first occurred through the date that the damages analysis is performed).
- The calculation of the amount of the expected future damages suffered by the owner/operator (for example, from the damages event date through the expected cessation of the effects of the damages event).
- The estimation of the expected time period (for example, a specified limited period or an unspecified perpetuity period) for duration of the damages.
- A consideration of the mitigation efforts of the owner/operator related to the damages event.
- The estimation of the effect of the damages event on the intangible asset’s RUL.
If sufficient data are available, analysts typically consider more than one valuation approach or method when damages are measured as an intangible asset value decrease or a cost to cure. In a damages analysis, analysts do not limit the examination to the valuation variables data that are available prior to the damages analysis date. Analysts should be aware that the estimation of damages may be governed by the legal rules of the jurisdiction in which the litigation is pending.
Owner/operator damages are typically experienced during a distinct period of time. Therefore, the quantification of the intangible asset damages may or may not be based on a perpetuity RUL projection.
Estimating an Intangible Asset Transfer Price
For federal income tax purposes, intercompany transfer pricing issues typically arise when one controlled entity transfers an intangible asset, a support service, or a tangible asset to another controlled entity. Such a transfer becomes relevant for federal taxation purposes when (1) one entity is located in a taxing jurisdiction different from the other entity and (2) both entities are under common control.
Multinational taxpayer corporations often manage their businesses by transferring or licensing intangible assets to related entities. The related entities could be subsidiaries or other controlled affiliates. National taxing authorities become interested in these intercompany asset and services transfers when the related entities are in two different taxing jurisdictions.
The intercompany transfer would be either (1) the cross border transfer of the ownership of the intangible asset or (2) the cross border transfer of the use of the intangible asset. The national taxing authorities are also interested in the cross border intercompany transfer of the ownership or use of tangible assets and the use of administrative or other corporate services. This discussion focuses on the cross border intercompany transfer of intangible assets (called intangible property for transfer pricing purposes). Once it is transferred cross border to the related entity, the technology intangible property may be more easily developed, maintained, and managed in order to maximize the multinational corporation’s consolidated income.
There are numerous operational, strategic, and legal motivations for implementing an intangible property intercompany transfer program. For example, a domestic parent corporation that owns a proprietary technology may license the use of that technology to its foreign manufacturing subsidiary. That use license may permit the foreign manufacture of the technology-related product at a substantially lower production cost than the prevailing domestic production cost.
Transfer price analyses relate to the intercompany transfer of intangible property between related (by common ownership) parties. These intercompany transfers result from the cross border sale, license, or contribution of the intangible asset. In the United States, Internal Revenue Code Section 482 (and the related Treasury Regulations) provides guidance with regard to intercompany transfer price rules and procedures. However, most other industrialized countries have similar international transfer price guidance provided in their own national tax laws. In fact, outside of the U.S., many industrialized countries have adopted the Organization for Economic Co-operation and Development (OECD) transfer price guidelines. In general theory, the OECD guidelines are very similar to the Section 482 Regulations.
In the U.S., Regulation 1.482-4 defines intangible property as any commercially transferable interest in any item that has substantial economic value independent of the services of any individual. That Regulation 1.482-4 intangible property list includes the following:
- Patents, inventions, formulas, processes, designs, patterns, or know-how
- Copyrights and compositions
- Franchises, license, or contracts
- Trademarks, trade names, and brand names
- Methods, programs, systems, and procedures
- Other similar items.1
The language of the regulations (generally similar to the OECD language) limits the type of intangible property subject to the intercompany transfer pricing analysis to intangible property that is legally transferable for federal income tax purposes.
The general principle underlying the determination of the Section 482 arm’s-length price (ALP) is the “commensurate with income standard.” The ALP that is paid for the use of an intangible property between related (for income tax purposes) entities should be commensurate with the income provided by the transferred intangible property. Therefore, the analyst should assess the factors that influence the income producing potential of the intangible property.
The analyst should understand the transfer pricing methods when estimating an ALP in connection with the intercompany intangible property transfer. Each Regulation 1.482-4(a) transfer price method has specific criteria for analyzing the intangible property. There are four transfer price methods that are specifically listed in Regulation 1.482-4(a) with regard to intangible property transfers: the comparable uncontrolled transaction (CUT) method, the comparable profit method (CPM), the profit split method, and unspecified “other methods.”2
Although each transfer price method is different, they all involve the analyst having a thorough understanding of the technology intangible property. For a transfer price analysis, analysts typically consider the following intangible property characteristics:
- Legal transferability
- Economic nature
- Business application
- RUL
- Contractual restrictions
- Rights to improvements or enhancements
When performing a transfer price analysis, analysts typically consider the specific intangible asset characteristics, how the intangible asset will be used by the related-party transferee entity, and the available Section 482 (or OECD) ALP methods.
Valuation Example
Exhibits 1 through 5 present an illustrative trade secret valuation. This intangible asset relates to the manufacture of a compressed meal replacement nutrition bar product by Alpha Nutrition Corporation (ANC). This example illustrates both a cost approach analysis and an income approach analysis.
The intangible asset is the compress and form manufacturing process (referred to as the “trade secret”) of the nutrition bar product recipe and formulation. This trade secret is documented in a set of engineering drawings and in a process flow chart notebook. ANC management has elected not to patent this trade secret for competitive reasons.
Management considers this proprietary technology to be a trade secret. All of the engineering and other documentation related to this manufacturing process is protected in a locked cabinet in the process engineering department. Only a select number of engineering and production managers have access to that information, and all of those employees have signed nondisclosure agreements.
ANC management also believes that the trade secret gives the company’s nutrition bar product a distinct competitive advantage. ANC marketing personnel stress this product differentiation feature in all of the company’s marketing materials and presentations.
Fact Set and Valuation Assumptions
The valuation objective is to estimate the fair value of the trade secret intangible asset as of December 31, 2014. The valuation purpose is for management information. Management is considering the sale of this intangible asset to a competitor. To help conclude the sale price, management is interested in what the buyer would record on its balance sheet.
Since the buyer and seller are assumed to be U.S. companies, the acquisition would be accounted for under U.S. generally accepted accounting principles (GAAP). In particular, the relevant U.S. GAAP would be the Financial Accounting Standards Board (FASB) Accounting Standards Codification (ASC) 805 acquisition accounting fair value for the trade secret.
However, the ASC 805 guidance is very similar to the corresponding guidance provided by international GAAP. The corresponding international GAAP is provided in International Accounting Standards Board (IASB) International Financial Reporting Standard (IFRS) 3, Business Combinations.
The alternative manufacturing methods available for producing such a nutrition bar product are extrusion, baking, and compression. The extrusion process provides a soft, chewy food bar. However the extrusion process, which involves pushing the raw material mass through a small orifice, reduces the identity of the product’s ingredients. The extruded product does not have the consumer appeal of the compressed product. The baking process provides a harder food bar, but it is still a chewy product. The temperatures required for the baking process cause a loss of the vitamins in the food product. The baked product also does not have the consumer appeal of the compressed product. The standard compression process requires the use of syrup
to bind the product ingredients together to form a food bar and produces a product that is both soft and chewy. The compressed product has greater consumer appeal than the extruded product or the baked product.
To overcome these process limitations, the process engineers developed a unique modification to the standard compression process. The process produces a product that has a crunchy texture and a snappy break. The final product maintains a good taste and a high nutritional value. The lower moisture content of the final product increases the retail shelf life of the product. The process produces a product with much greater consumer appeal than the extruded product, the baked product, or the standard compressed product. The product can be produced at the same cost of sales than the lower quality competitor products.
Valuation Approaches and Methods
In this analysis, the standard of value is fair value. The premise of value is value in continued use. This premise of value is consistent with the valuation assignment and the analyst’s assessment of the intangible asset’s HABU.
Based on the quality and quantity of available data and the purpose and objective of the analysis, the analyst decided to use two valuation approaches: the cost approach—specifically the replacement cost new less depreciation (RCNLD) method—and the income approach—specifically the differential income method.
Cost Approach
The cost approach typically involves estimating either a reproduction cost new or a replacement cost new. The reproduction cost new equals the cost to construct an exact replica of the intangible asset. The replacement cost new is the cost to recreate a new intangible asset with an equivalent utility of the actual asset.
The analyst decided to use the RCNLD method to value the trade secret. The analyst had access to the historical trade secret development costs. This type of historical cost information is not always available. Because this trade secret was so important, management tracked the original efforts related to its development.
Valuation Variables. The analyst considered the historical efforts (in terms of person-months) of each food engineer, scientist, researcher, chef, and manager involved in the trade secret development. After consultation with management, the analyst eliminated any duplicate or unproductive efforts from this personmonth estimate. (Therefore, the analyst eliminated any functional obsolescence.) The analyst multiplied the current person-month by the current full-absorption cost related to that personnel position. The product of such a multiplication is the replacement cost new (RCN).
Management provided information regarding the actual number of hours spent by ANC food engineers and scientists on the various aspects of the process development. The analyst estimated a full absorption cost related to the employees who developed the trade secret. This full absorption cost included all employee salaries, employee benefits, employment-related taxes, and related company overhead. This full absorption cost also included a component for development period interest related to the direct costs.
The analyst calculated each of these full absorption cost components as of the valuation date. Based on this analysis, the analyst concluded the current cost per person-hour for all of the ANC employee hours actually spent on the development, testing, and implementation of the trade secret.
The product of (1) the total number of person-hours actually spent to develop the trade secret and (2) the full absorption cost per person-hour results in the trade secret RCN.
To the extent that the intangible asset is less than an ideal replacement for itself, the RCN should be adjusted accordingly. The analyst considered adjustments to the RCN for losses in value due to incurable functional obsolescence and economic obsolescence. The analyst considered (1) the intangible asset age and RUL, (2) the intangible asset position within its technology life cycle, and (3) the owner/operator’s return on investment related to the intangible asset use.
Exhibit 1 summarizes the RCNLD analysis. The RCN includes the cost components of direct costs, indirect costs, developer’s profit, and entrepreneurial incentive. The direct costs include the direct salary costs and the related employee benefit cost and employment taxes of the process development team. The indirect costs include overhead allocation costs paid to outside consultants and development period interest expense. The developer’s profit includes the analyst’s estimate of the profit margin that an independent engineering firm would charge to ANC if that engineering firm was retained to develop the proprietary compression process. The entrepreneurial incentive is the opportunity cost related to the intangible asset development process.
In this analysis, the analyst quantified this opportunity cost as the difference in the amount of cash flow that ANC would earn with versus without the trade secret. The analyst estimated that incremental cash flow during the period of elapsed time required to replace the trade secret de novo. ANC engineers estimated that the development period would be 24 months.
As indicated in Exhibit 1, the trade secret RCN was $10,784,000. The analyst concluded that a 10 percent functional obsolescence allowance is appropriate. That 10 percent obsolescence allowance results in $1,078,000 of depreciation. Accordingly, the trade secret RCNLD is $9,706,000.
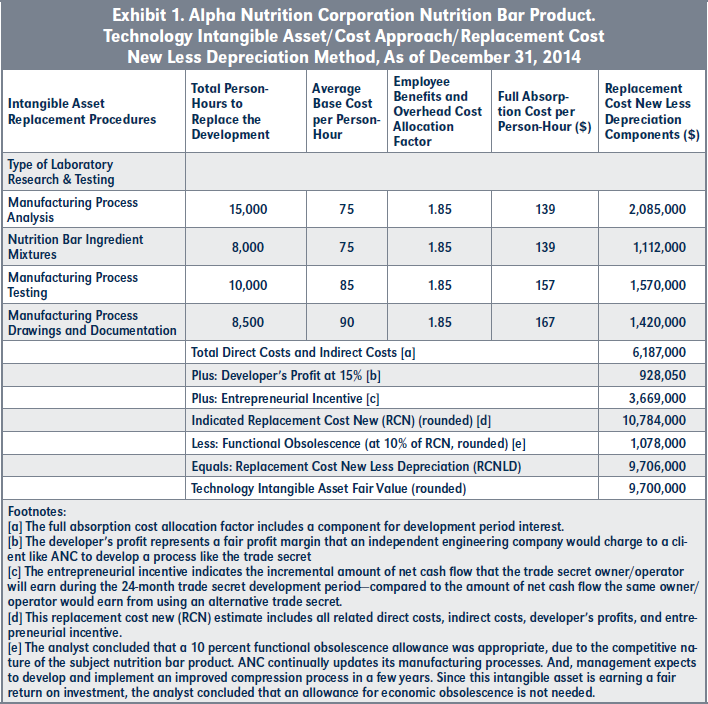
Value Conclusion. As presented in Exhibit 1, the intangible asset fair value based on the cost approach, as of December 31, 2014, is $9,700,000 (rounded).
Income Approach
The differential income method is an income approach method that measures value based on the difference between (1) the expected owner/operator income with the intangible asset in operation and (2) the expected owner/operator income without the intangible asset in operation.
Using the differential income method, first the analyst projected the prospective cash flow associated with the trade secret use. Second, the analyst projected the prospective cash flow that would be generated without the trade secret use. The income approach value indication is based on the difference between the present value indications from the two different operating scenarios (that is, with and without the trade secret in operation).
Valuation Variables. Management provided projections of the nutrition bar product unit selling price, unit volume, and market share for the five years after the valuation date. Management also projected the cost of goods sold and the capital expenditure data related to the nutrition bar production. Management prepared a five year projection of the selling, general, and administrative expenses. After a due diligence review, including interviews with management, the analyst concluded that these financial projections were reasonable. Based on the quality and quantity of these prospective financial data, the analyst concluded that the income approach provides a supportable value estimate. Based on the prospective financial data available, the analyst selected net cash flow as the appropriate income measure. For purposes of this valuation, the analyst defined net cash flow as follows.
Net Sales
Less: Cost of sales
Less: Operating expenses
Equals: Net income before taxes
Less: Income taxes
Plus: Depreciation and amortization expense
Less: Capital expenditures
Less: Additions to net working capital
Less: Contributory asset charge
Equals: Net cash flow
Management projected the product line net cash flow over the intangible asset’s RUL. The analyst discounted the net cash flow projection at an appropriate discount rate to conclude a present value. The difference between the present value of the product line net cash flow with the trade secret in operation and without the trade secret in operation equals the intangible asset value.
Based on its industry experience, management expects that it will develop a replacement trade secret process in about five years. Both ANC and its competitors continuously develop improved products that are produced by improved manufacturing processes. The ANC process engineering staff is already working on the development of a new and improved compression process. Management expects that the new and improved process will be developed, tested, and implemented within five years. At that time, the current trade secret will be obsolete and replaced by the new and improved process. The analyst selected five years as the trade secret RUL.
The analyst selected the following valuation variables for this analysis:
Scenario I: With the trade secret in operation
- Net sales growth rate: 10 percent per year
- Gross margin percentage: 26 percent of net sales
- Other operating expenses: 11 percent of net sale
- Effective income tax rate: 36 percent of pretax income
- Depreciation expense: 1 percent of net sales
- Net capital expenditures: equal to depreciation expense
- Contributory asset charge: $2.2 million per year
- Incremental net working capital: 5 percent of net sales
- Present value discount rate: 15 percent
- RUL estimate: 5 years
Scenario II: Without the trade secret in operation
- Expected sales decrement: –10 percent per year
- Other operating expenses: 11.5 percent of net sales
- Incremental net working capital: 7 percent of net sales
- All other valuation variables remain unchanged from Scenario I
The contributory asset charge is included to account for the fair return of and on the investment of all the contributory assets that are used or used up in the production of the income associated with the trade secret. The contributory assets include net working capital, tangible operating assets, and the trade name.
The projected decrease in product line sales without the trade secret in operation is based on management discussions. This projected sales decrease indicates management’s estimate of the consumer response to the decrease in taste, crunchiness, and retail shelf life of the company’s product without the trade secret intangible asset. The negative expected sales growth rate decrement of minus 10 percent each year (compared to the projected sales level with the trade secret in place) reflects management’s projection of the combined effects of decreased unit selling price and decreased unit volume sales.
Without the product differentiation provided by the trade secret, management estimates that it would have to increase its marketing expense. This marketing expense increase accounts for the one-half of one percent projected increase in other operating expenses.
Management projects that it would have to liberalize its customer credit policy in order to stimulate sales of the less desirable product. Management estimates that it would have to give 60 day credit terms instead of 30 day credit terms. This expected change in credit policy would affect the accounts receivable balances. This change in credit policy would result in an expected change in the net working capital investment.
The 15 percent present value discount rate is based on the ANC weighted average cost of capital (WACC). The analyst concluded that this discount rate is appropriate based on the selected net cash flow income measure projected in the analysis and the stated standard of value and premise of value.
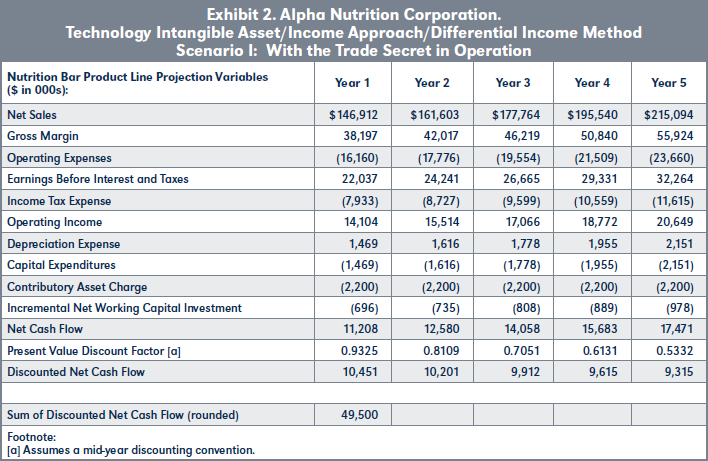
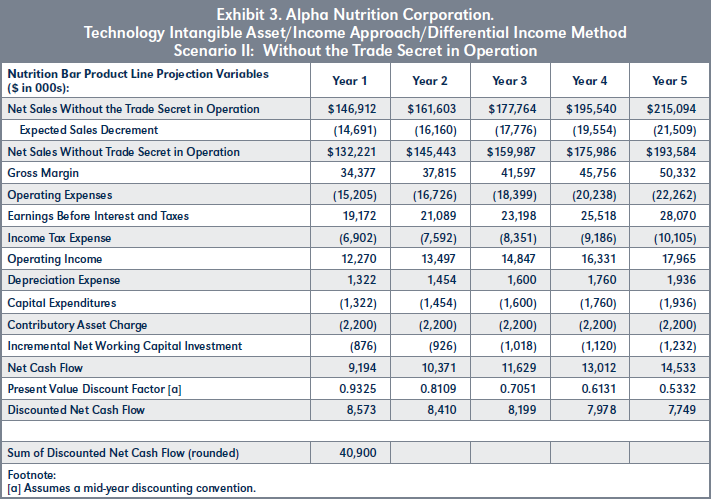
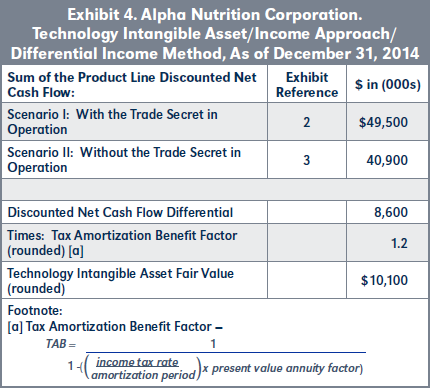
Value Conclusion. As presented in Exhibit 2, the sum of the product line discounted cash flow with the trade secret in operation is $49,500,000. As presented in Exhibit 3, the sum of the product line discounted cash flow without the trade secret in operation is $40,900,000. The difference between these two income projections indicates a differential of $8,600,000.
As presented in Exhibit 4, the unadjusted net cash flow differential is $8,600,000. This unadjusted differential does not consider the fact that, in the U.S., this intangible asset would qualify as an Internal Revenue Code Section 197 intangible asset to the buyer. The national tax laws of many other industrialized nations contain similar intangible asset amortization deduction provisions. Since this is a fair value valuation performed for financial accounting purposes (under both U.S. and international GAAP), the economic benefit related to Section 197 intangible asset tax amortization benefit (TAB) should be considered. An intangible asset that is amortizable for federal income tax purposes provides an income tax expense reduction (that is, a cash flow benefit) to the intangible asset buyer. That cash flow benefit is typically calculated as the present value of the expected reduction in future income tax expense due to the amortization tax deductions.
The TAB factor calculation follows:

The analyst applied the TAB factor to the present value of the net cash flow differential associated with the trade secret. The TAB factor was calculated based on (1) the income tax amortization period for the intangible asset (15 years under Section 197), (2) the market-derived effective income tax rate of 36 percent, and (3) the present value discount rate of 15 percent. Based on the TAB formula, the TAB factor for this analysis is 1.2 (rounded). The discounted net cash flow differential of $8,600,000 times the income TAB factor of 1.2 indicates the trade secret value.
As presented in Exhibit 4, the technology intangible asset fair value based on the income approach, as of December 31, 2014, is $10,100,000.
Value Conclusion
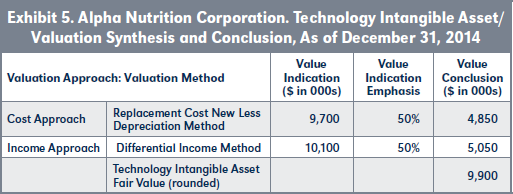
The analyst decided to assign equal weight to the two value indications. In synthesizing the results of the cost approach and the income approach, the analyst considered both (1) the quantitative and qualitative assessment of the data underlying each valuation approach and (2) the relevance of each valuation approach based on factors specific to the trade secret.
Based on the analyses presented in Exhibits 1 through 4, the fair value of the technology intangible asset, as of December 31, 2014, is $9.9 million (rounded). Exhibit 5 presents the synthesis and conclusion for this illustrative valuation.
Summary
When analyzing a technology intangible asset, analysts consider the purpose and objective of the assignment as well as the relevant factors specific to the technology. This discussion summarized the typical attributes of a technology intangible asset and the specific factors to consider when assessing technology intangible asset value, damages, and transfer price. Finally, this discussion presented an example of a technology intangible asset valuation. The illustrative example presented a cost approach method and an income approach method to estimate the fair value of a technology intangible asset (a trade secret).
1. Treasury Regulation Section 1.482-4(b).
2. Treasury Regulation Section 1.482-4(a).